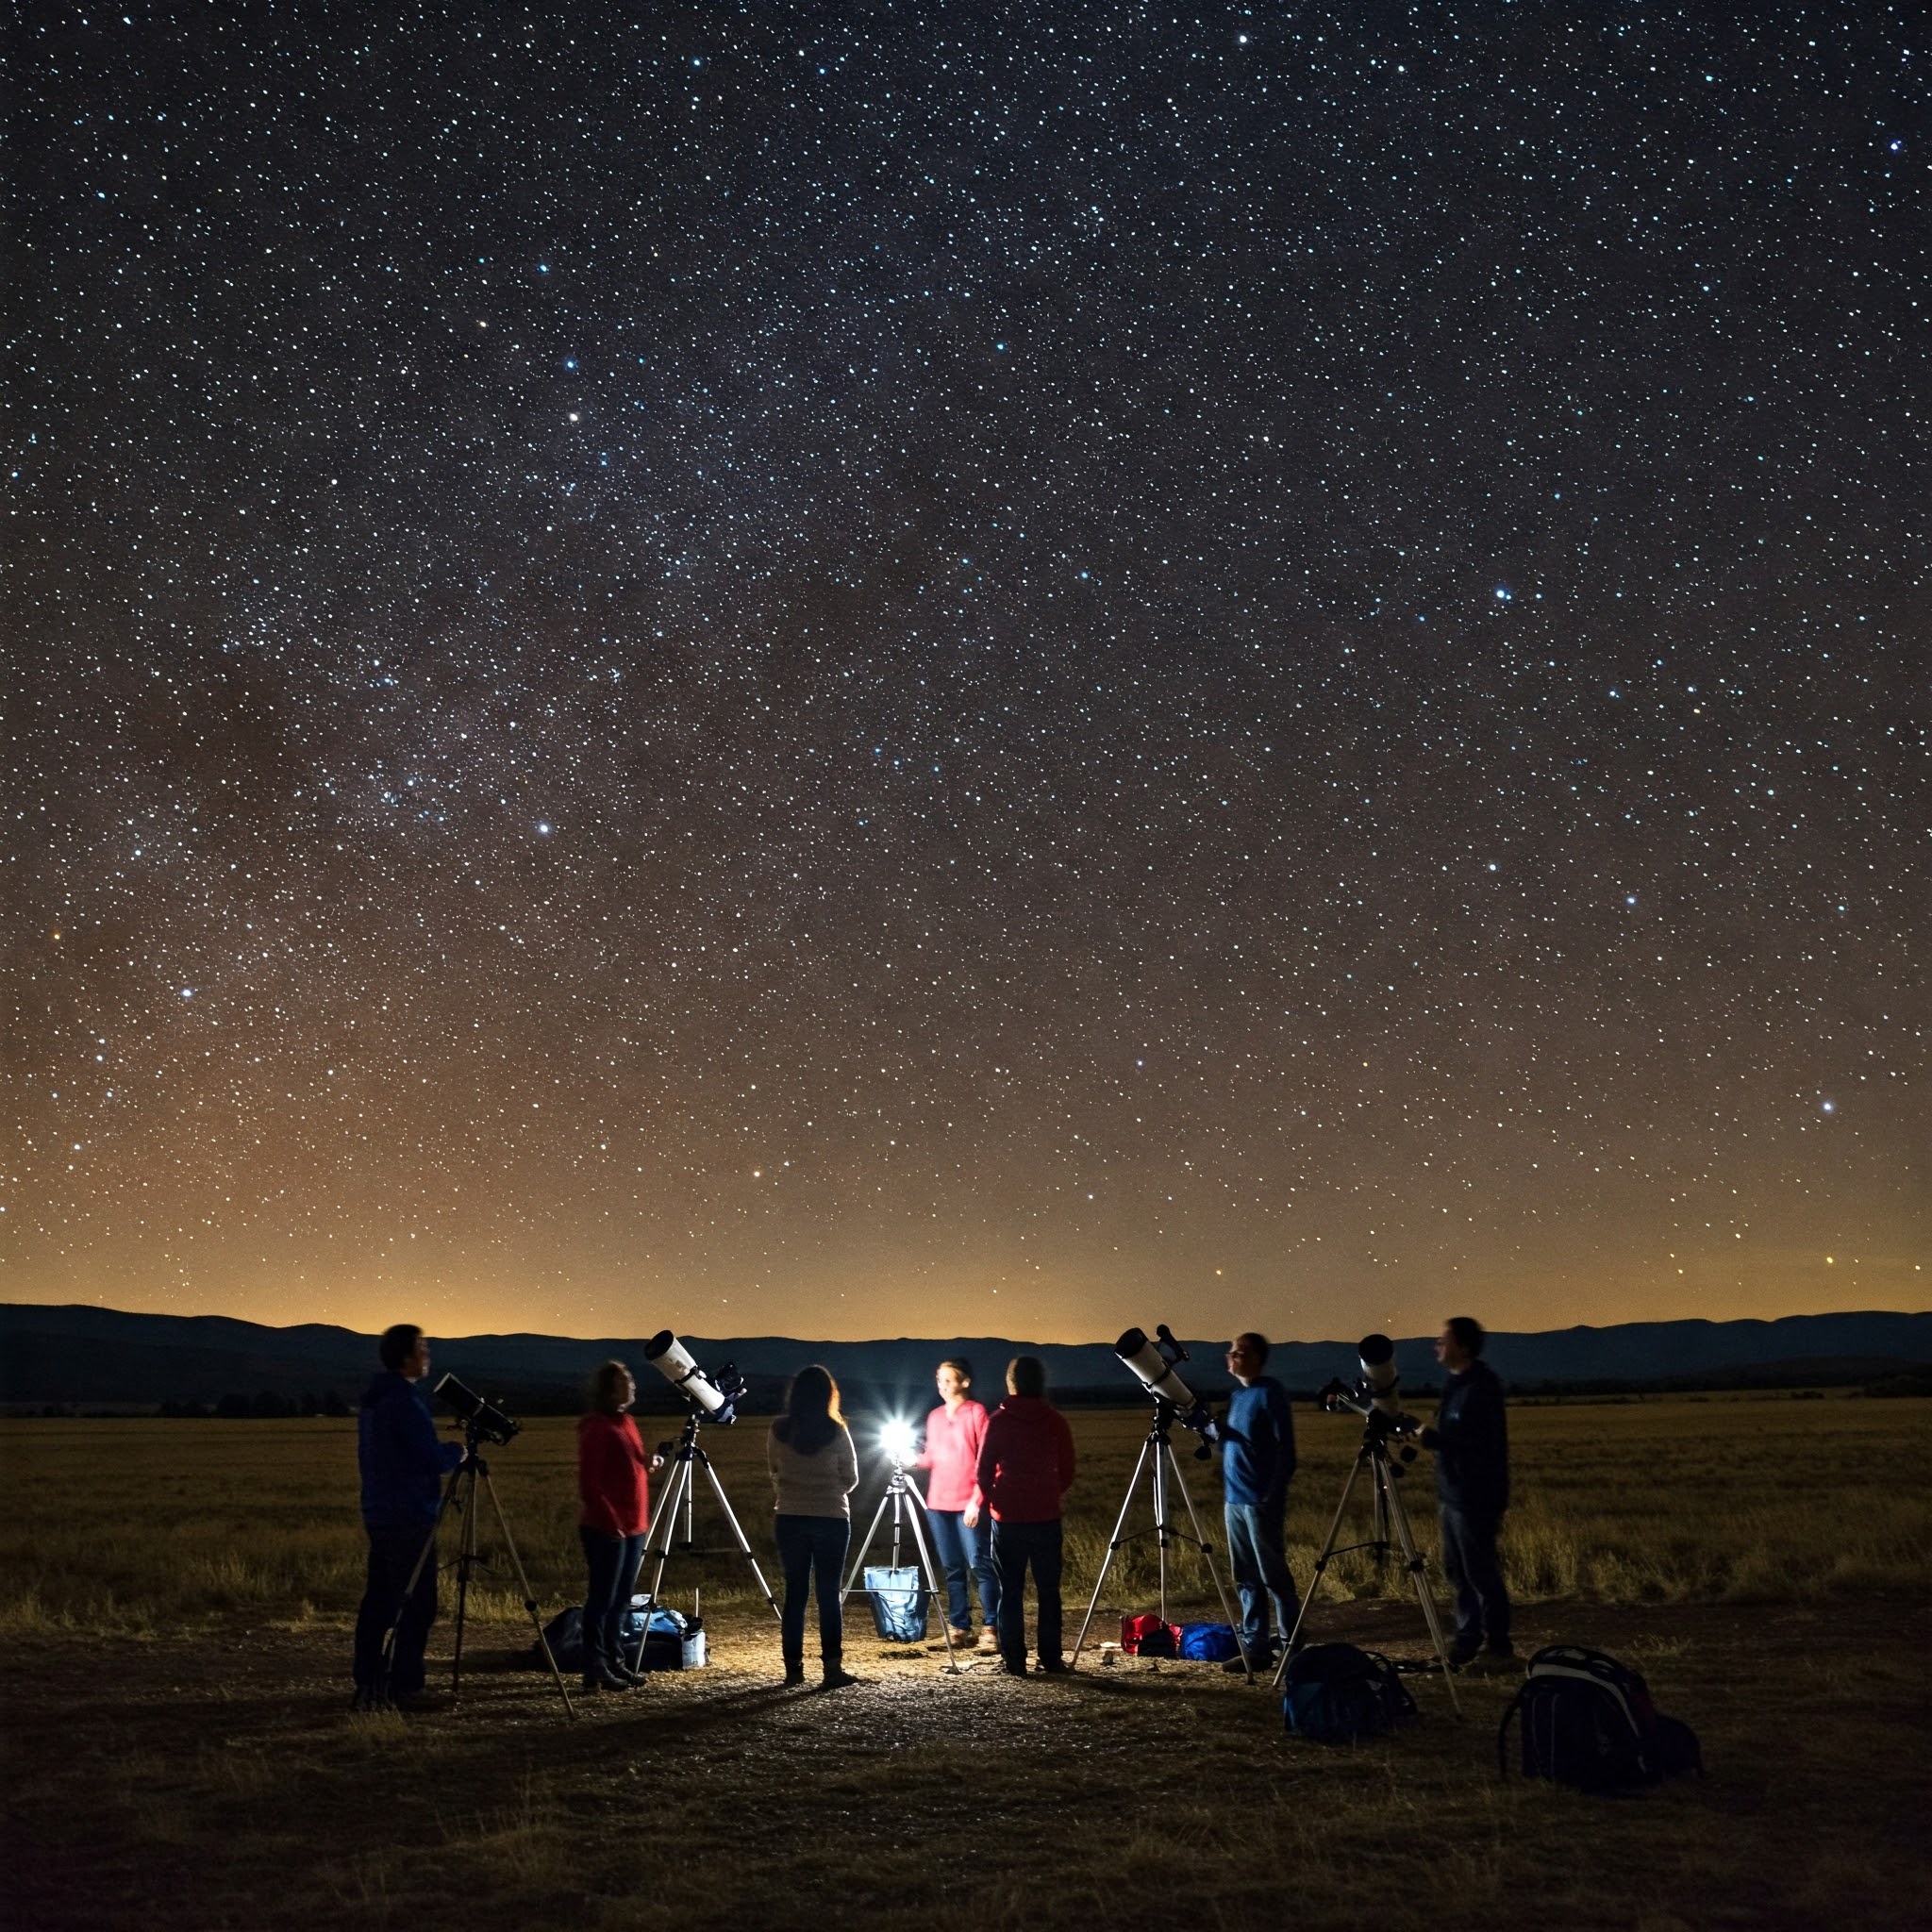
Look Up! The Growing Allure of Dark Sky Tourism & the Fight Against Light Pollution
"Losing the dark is about more than just stars. It impacts wildlife, human health, and our fundamental connection to the universe. We're only just beginning to understand the cost of eternal daylight." - International Dark-Sky Association Advocate
The Mathematical Beauty of Darkness
The relationship between light pollution and observable celestial objects follows a logarithmic relationship that can be described mathematically. The number of visible stars (N) can be modeled as:
$\(N = N_0 \cdot 10^{-0.4 \cdot m_{LL}}\)$
Where N₀ is the number of stars visible under perfect conditions, and m_LL is the limiting magnitude reduction due to light pollution.
The Sky Quality Measure (SQM) in magnitudes per square arcsecond follows an inverse relationship with artificial light intensity:
$\(SQM = -2.5 \log_{10}(B_{natural} + B_{artificial}) + C\)$
Where B represents brightness values and C is a calibration constant.
The Light Pollution Process Visualized
This flowchart visualizes how light pollution develops and its cascading effects on various systems.
Comparing Dark Sky Quality Across Locations
| Location | Bortle Scale | SQM Value (mag/arcsec²) | Visible Objects | Light Pollution Reduction Efforts | Tourism Development |
|---|---|---|---|---|---|
| Urban Centers | 8-9 | 16-18 | Moon, planets, brightest stars | Limited; some city ordinances | Astronomy centers, planetariums |
| Suburban Areas | 6-7 | 19-20 | Brighter constellations, some clusters | Growing; residential guidelines | Star parties, eclipse events |
| Rural Areas | 4-5 | 21-21.5 | Milky Way visible, many clusters | Moderate; county-level policies | Weekend astrotourism destinations |
| Dark Sky Parks | 2-3 | 21.5-22 | Detailed Milky Way, nebulae | Strong; IDA certification requirements | Dedicated facilities, guided programs |
| Remote Wilderness | 1 | >22 | Maximum naked-eye visibility | Natural darkness preservation | Expedition-style dark sky tourism |
The Science Behind Visual Light Adaptation
Human vision adaptation to darkness follows complex mathematical patterns. Dark adaptation can be modeled as an exponential function:
$\(S(t) = S_{max} \cdot (1 - e^{-k \cdot t})\)$
Where S(t) is visual sensitivity at time t, S_max is maximum sensitivity, and k is the adaptation rate constant.
The probability of detecting faint celestial objects depends on multiple factors:
$\(P(detection) = \frac{e^{\beta_0 + \beta_1x_1 + \beta_2x_2 + ... + \beta_nx_n}}{1 + e^{\beta_0 + \beta_1x_1 + \beta_2x_2 + ... + \beta_nx_n}}\)$
Where x₁, x₂, ..., xₙ represent factors such as object brightness, sky background, viewer's dark adaptation, and observational experience.
Decision Trees in Dark Sky Preservation
The Evolution of Dark Sky Protection
Mathematical Models of Light Pollution Spread
The propagation of sky glow from urban centers can be modeled using modified Walker's Law:
$\(I = I_0 \cdot \left(\frac{d}{d_0}\right)^{-n} \cdot e^{-kd}\)$
Where I is light intensity at distance d from the source, I₀ is intensity at reference distance d₀, n is an exponent typically between 2.5-3, and k is an atmospheric extinction coefficient.
The cumulative effect of multiple light sources can be calculated as:
$\(I_{total} = \sum_{i=1}^{n} I_i(d_i) \cdot \cos(\theta_i) \cdot f(\phi_i)\)$
Where θᵢ is the emission angle, and f(φᵢ) accounts for the angular distribution of the light fixture.
Dark Sky Tourism as a Complex System
The Physics of Light Pollution and Astronomical Observation
| Phenomenon | Mathematical Representation | Impact on Observation | Mitigation Strategies |
|---|---|---|---|
| Rayleigh Scattering | \(I \propto \lambda^{-4}\) | Blue light scatters more, creating broader sky glow | Use of amber/red lighting, cut-off wavelengths |
| Mie Scattering | \(I \propto \lambda^{-\alpha}\) where \(0 < \alpha < 4\) | Particulate matter increases scattering | Air quality management, timing observations |
| Extinction | \(m = m_0 + k \cdot X\) | Atmospheric absorption reduces apparent magnitude | Site selection, altitude considerations |
| Contrast Reduction | \(C = \frac{I_{object} - I_{background}}{I_{background}}\) | Lower contrast makes objects harder to detect | Light shielding, distance from sources |
| Circadian Disruption | Function of blue light exposure timing | Affects human health and wildlife behavior | Spectral control, timing restrictions |
The relationship between observable limiting magnitude and zenith sky brightness follows:
$\(m_{lim} = C_1 - 5 \log_{10}(10^{(C_2 - SQM)/5} + C_3)\)$
Where C₁, C₂, and C₃ are constants derived from observational data.
Looking to the Future
As dark sky tourism continues to grow, it creates a unique opportunity to merge conservation, education, and economic development. The preservation of natural darkness represents a crucial intersection of environmental protection, human health, cultural heritage, and our fundamental connection to the cosmos.
"We all live under the same sky, but we don't all have the same horizon." — Konrad Adenauer
This article examines the multifaceted issue of light pollution through both scientific and cultural lenses, highlighting the growing movement to reclaim our view of the stars and the mathematical principles that govern our perception of the night sky.
